What the last 3 years of AAPI hate looked like in Massachusetts
A retrospective of anti-Asian hate across the state
“There is an overall general sentiment of fear,” said Quincy City Councilor Nina Liang. “As an AAPI resident here in the city, just in general, there’s been a lot of animosity towards the community and not just since the pandemic, but the pandemic, I think, certainly put it front and center for folks.”
From violent hate crimes and vandalism to name-calling and discrimination, scapegoating has fueled countless anti-AAPI hate incidents across the United States since the start of the pandemic. From 2019 to 2020, there was a 77% increase in the number of anti-Asian hate crimes compiled by the FBI. At that same time, the number of reporting agencies decreased by 452 across the United States, meaning that the spike in hate crimes was likely underreported.
According to Stop AAPI Hate, a coalition launched in March of 2020 that tracks and responds to hate incidents against Asian Americans and Pacific Islanders, or AAPI, in the United States, this surge was worsened by politicians such as President Trump blanketly blaming China for the virus’s spread. Among Asian Americans surveyed in 2021, Donald Trump was cited as the single most significant cause of increased Asian hate in the United States, but respondents also said that racism, misinformation and the news media were other contributing factors.
One Boston woman reported to Stop AAPI Hate: “I went to a store a block away from my building. On my way back, at a red light, a man in a car rolled down his window to scream at me, ‘China did this to us, to Americans, f*** you, f*** China, yeah I’m talking to you, b****’ with slurs and acted as though he was going to get out of his car before he sped off.”
According to Stop AAPI Hate, 11,467 hate incidents were reported throughout the United States between March 19, 2020 and March 31, 2022. Massachusetts had the sixth highest number of reports of any state, with 340 reported hate incidents. These reports include acts of hate, violence, harassment, discrimination, shunning and child bullying that impact AAPI individuals but may not meet the statutory threshold to constitute a hate crime. The high statutory threshold for a hate crime leads to many instances of discrimination and violence being ignored by law enforcement agencies. Stop AAPI Hate’s incident tracking is an effort to address that gap in reporting.
For the AAPI community in the United States, such scapegoating is not new. Just as the spread of COVID-19 saw many politicians blaming China for the pandemic, an economic downturn at the beginning of the 1980s in Detroit’s auto industry saw “Buy American” campaigns blaming Japan and its imported vehicles for the economic hardships that U.S. autoworkers felt. Through xenophobic advertisements, bumper stickers and company policies, these “Buy American” campaigns promoted by the three largest American automotive corporations — Ford, Chrysler and General Motors — intentionally inflamed the “Japan-bashing” that characterized much of the movement.
It was such a culture that set the background for one of the most brutal murders: the death of Vincent Chin. In the summer of 1982, Chin, a Chinese American man, was out celebrating his bachelor party at a club in Highland Park, Michigan. Two men in the club, Ronald Ebens and his stepson Michael Nitz, began arguing with Chin after mistaking him for being Japanese. The conflict continued to escalate until Ebens, wielding a baseball bat he’d retrieved from his car, beat Chin into a brain-dead coma. Chin died four days later.
Paula Yoo, author of “From A Whisper to A Rallying Cry: The Killing of Vincent Chin and the Trial That Galvanized the Asian American Movement,” said in an interview with NPR that “[Chin’s death] inspired Asian Baby Boomers. They came of age [about standing up for themselves and other people of color]. This was part of their civil rights education.” For organizations like Stop AAPI Hate and individuals like Councilor Liang, pandemic-era scapegoating has done much the same.
“When I was first running for office back in 2015, it wasn’t people calling me names and it wasn’t people saying ‘Go back to where you came from,’” said Liang. “What honestly chipped me down, what wore me down the most was people always asking me, ‘Where are you from?’ They never asked my fellow colleagues that.”
Frustrated with the question, Liang said she’s pushing back and trying to re-educate and reform the question for people.
“I don’t think there’s any malice there, but by asking that it makes me feel othered,” Liang said. “I don’t know that I’d go so far as to call it racism, but it’s a form of othering and the feeling is just the same as when I was a kid and people would say, ‘You’re a c****.’”
Such discrimination can often go overlooked when viewed in the context of anti-AAPI hate crimes, but these more subtle forms of discrimination still leave lasting impacts on individuals like Liang.
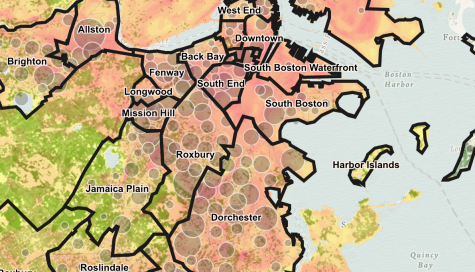
Harvard’s Asian Implicit Association Test gives a glimpse into the attitudes behind these often overlooked forms of discrimination. Data shown here includes over 20,000 individual respondents in Massachusetts from 2004 to 2021. The test measures how strongly respondents associate Asian American, versus European American, faces with American or foreign symbols. Each respondent’s test is measured with an Implicit Association Test, or IAT, score. These scores range from −2 to 2, with negative values indicating a bias that Asian Americans are more American than European Americans (“pro-Asian bias”), a score of zero indicating no bias, and positive values indicating a bias that European Americans are more American than Asian Americans (“pro-white bias”).
Location data for respondent results are organized by regions called Metropolitan Statistical Areas, or MSA. This system is used to sufficiently anonymize respondents, but it can still provide a broad overview of what bias looks like across Massachusetts.
The Boston MSA, where the majority of Asian Americans in Massachusetts live, is the least biased region in the state in terms of implicit bias. However, when questioned directly about racial views, respondents in the Boston MSA on average said that white Americans are 21% more American than Asian Americans, placing it on par with the state average of 20.6%.
To measure this explicit bias, respondents were asked questions about their perceptions of Asian Americans and white Americans, labeled above as “Asian Americanness” and “white Americanness.” For the questions, the test asks respondents “In your mind, how American are Asian Americans? That is, how strongly are they identified with America and all things American?” A score of one means “Not at all American” while a score of seven means “Absolutely American.”
On average, the difference between females and males (as assigned at birth) is negligible compared to factors like age. An older respondent is far more likely to show more pro-white bias than younger respondents. This is also not likely due to the idea that individuals become more conservative as they age, as researchers have found that “political attitudes are remarkably stable over the long term,” according to a study at the University of Chicago. In fact, data not only shows that political attitudes remain consistent as individuals age, but that each new generation is consistently more liberal than the last.
Race and political identity are some of the most important factors when it comes to someone’s implicit bias. Across all races, pro-white bias was consistently lower among more liberal respondents, with liberal AAPI respondents showing no pro-white bias.
Race is another strong indicator of implicit bias. White respondents, for instance, were more pro-white biased across all political identities than virtually every other group. By contrast, East Asian respondents, on average, scored some of the lowest IAT scores of any racial group, regardless of political identity.
While IAT data can help to provide some insight into the more subtle forms of discrimination that Boston’s AAPI community faces, it should not be taken as an unquestionable fact. Individuals who take Harvard’s Asian IAT may not accurately reflect the broader population across Boston and Massachusetts as a whole. With this in mind, transparency becomes the best option when it comes to understanding the significance of the data outlined here.
Here is an interactive graphic displaying the 20,000-plus respondents on an individual level.
Click here to take the Asian IAT, if you are interested.


